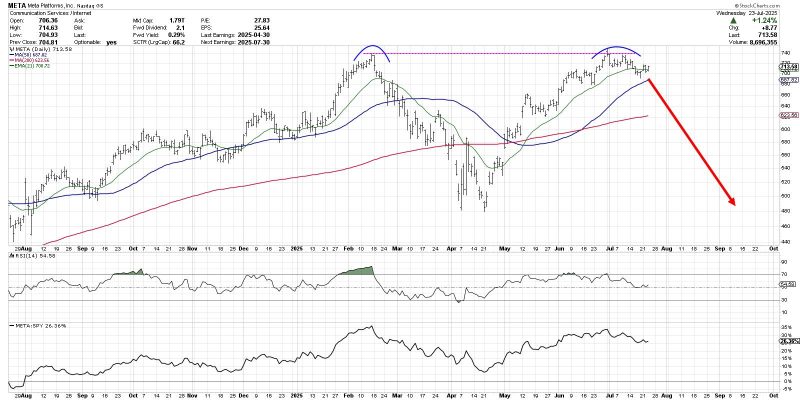
The chart of Meta Platforms, Inc. (META) has completed a roundtrip from the February high around $740 to the April low at $480 and all the way back again. Over the last couple weeks, META has now pulled back from its retest of all-time highs, leaving investors to wonder what may come next.
Is this the beginning of a new downtrend phase for META? Or just a brief pullback before a new uptrend phase propels META to new all-time highs?
Today we’ll look at two potential scenarios, including the double top pattern and the cup and handle pattern, and share which technical indicators and approaches could help us determine which path plays out into August.
The double top scenario basically means that the late July retest of the previous all-time high was the end of the recent uptrend phase. The double top pattern is literally when a major resistance level is set and then retested. The implication is that a lack of willing buyers means the uptrend is exhausted, and there is nowhere to go but down.
While the 21-day exponential moving average is currently in play for META, I would say that a break below the 50-day moving average could confirm this as the correct scenario. If that smoothing mechanism does not hold, then the price action would imply less of a pullback and more like the beginning of a real distribution phase.
What is META pulls back but then resumes an uptrend phase, leading META to another new all-time high? That would result in a confirmed cup and handle pattern, created by a large rounded bottoming pattern followed by a brief pullback. The key to this pattern is the “rim” of the cup, which sits right at $740 for META.
Given the pullback META has demonstrated so far in July, I would say that a break above the $740 level would basically confirm a bullish cup and handle pattern. That would suggest much more upside potential for META, as the stock would literally go into previously uncharted territory.
So how can we determine which scenario is more likely to play out? This is where we need to incorporate more technical indicators into the discussion, as a way to further validate and confirm our investment thesis.
Just to review, I think a break above $740 would confirm a bullish cup and handle pattern. I would also say that a break below the $680 level, which would represent a move below the 50-day moving average as well as the June swing lows, would basically confirm a bearish double top pattern.
We can also use the Relative Strength Index (RSI) to help determine whether META remains in a bullish trend phase. During bull phases, the RSI rarely gets below 40, because buyers usually step in to “buy the dips” and keep the momentum fairly constructive. So if the price would break down, and the RSI would not hold that crucial 40 level, that could mean a bearish outlook is warranted.
Finally, we can use volume-based indicators to assess whether moves in the price are supported by stronger volume readings. Here I’ve included the Accumulation/Distribution Line, which tracks the trend in daily volume readings over time. We can see that the high in July resulted in a divergence, as the A/D line was trending lower. If the A/D line would break below its June and July lows, marked by a dashed red line, that would represent a bearish volume reading for META.
Technical analysis is less about predicting the future, and more about determining the most probable scenarios based on our analysis of trend, momentum, and volume. I hope this discussion shows how the outlook for META can be easily determined and tracked using the best practices of technical analysis!
RR#6,
Dave
PS- Ready to upgrade your investment process? Check out my free behavioral investing course!
David Keller, CMT
President and Chief Strategist
Sierra Alpha Research LLC
https://www.youtube.com/c/MarketMisbehavior
Disclaimer: This blog is for educational purposes only and should not be construed as financial advice. The ideas and strategies should never be used without first assessing your own personal and financial situation, or without consulting a financial professional.
The author does not have a position in mentioned securities at the time of publication. Any opinions expressed herein are solely those of the author and do not in any way represent the views or opinions of any other person or entity.